Function Tracing
With Go, Lambda and X-Ray
When we build an app with many Lambda functions that use many AWS services, it can become a challenge to spot and diagnose errors.
Imagine if we see error from a worker API. How do we know if error was due to:
- AWS API Gateway internal error
- AWS Lambda capacity problem
- Our worker function panic
- Our worker function unhandled error
- Our worker function timing out
- AWS S3 permission error
We will naturally add more logging to our Go code over time to help understand execution. But Go on Lambda offers a new and compelling strategy for observability: tracing.
Tracing is a technique that big companies like Amazon, Google and Twitter rely on to understand their large-scale distributed systems.
With tracing, every request that comes in is given a unique request ID. Then care is taken to pass this request ID along to every subsystem that works on the request so they can report detailed, structured information about how they handled the request. This information is reported as “segments” of work – data with a start time, end time and other metadata like a function name, return value or error message.
One system might emit segments for many short function calls, then a single long RPC call. And the system that performs the RPC call itself might emit many segments for its function calls.
A centralized tracing service collects data from all the disparate systems and server and assembles them to provide a full picture of the life cycle of the request. We can now see total response time, individual steps and their duration, and in the case of a failure, pinpoint exactly where it happened.

We can also “zoom out” on to understand the service as a whole.
Above we can see that within the last 6 hours there have been significant error rates in two of our Lambda functions. The response duration statistics offers a big hint… While most of our functions respond in a few miliseconds, one of the functions is responding in 5 seconds. It seems we have a function timeout problem…
Note: This is part of a series about writing and Go Functions-as-a-Service on AWS Lambda and related services like API Gateway, S3 and X-Ray.
If you’d like to experiment with these techniques yourself, check out https://github.com/nzoschke/gofaas for a boilerplate app with all the pieces configured correctly and explained in depth.
AWS Config – X-Ray and Lambda
Tracing is a first-class concept on AWS Lambda. We can turn on “active tracing” in the SAM Globals section or as a property of every Lambda function:
Globals:
  Function:
    Tracing: Active

Resources:
  WorkerFunction:
    Properties:
      Tracing: Active
    Type: AWS::Serverless::Function
From template.yml
When this is enabled, AWS will automatically run a X-Ray daemon for our Lambda function.
Go Code – Context pattern
Tracing is effectively a first-class concept in Golang too.
Go was created by Google with a goal of making distributed systems programming easy, so it should come as no surprise that it well-suited for tracing. The standard library has what we need: the context package and the Context type.
We may have noticed that every Lambda function takes a first argument of ctx context.Context. We also see the ctx argument in many other Go packages like the AWS SDK. This variable provides a way to share information, like a request ID or a parent segment structure, across all our code and 3rd party libraries we use. Go opts for a variable for safety – we can’t safely share data between all the systems, we have to pass data down to them.
package gofaas

import (
	"context"
	"os"

	"github.com/aws/aws-sdk-go/aws"
	"github.com/aws/aws-sdk-go/service/dynamodb"
	"github.com/aws/aws-sdk-go/service/kms"
	"github.com/pkg/errors"
)

func userPut(ctx context.Context, u *User) error {
	if u.TokenPlain != "" {
		out, err := KMS().EncryptWithContext(ctx, &kms.EncryptInput{
			Plaintext: []byte(u.TokenPlain),
			KeyId:     aws.String(os.Getenv("KEY_ID")),
		})
		if err != nil {
			return errors.WithStack(err)
		}

		u.Token = out.CiphertextBlob
		u.TokenPlain = ""
	}

	_, err := DynamoDB().PutItemWithContext(ctx, &dynamodb.PutItemInput{
		Item: map[string]*dynamodb.AttributeValue{
			"id": &dynamodb.AttributeValue{
				S: aws.String(u.ID),
			},
			"token": &dynamodb.AttributeValue{
				B: u.Token,
			},
			"username": &dynamodb.AttributeValue{
				S: aws.String(u.Username),
			},
		},
		TableName: aws.String(os.Getenv("TABLE_NAME")),
	})
	return errors.WithStack(err)
}
From user.go
When working with the AWS SDK we make sure to use the WithContext methods. See the Context Pattern added to the AWS SDK for Go blog post to learn about more ways the context pattern helps us build our app.
Go Code – Xray SDK
Next we reach for the aws/aws-xray-go-sdk package. This gives us a way to generate segment data and send it to a local X-Ray daemon which will eventually forward traces to the X-Ray API.
To start, the SDK lets us wrap the AWS SDK so that all AWS API calls are traced:
package gofaas

import (
	"github.com/aws/aws-sdk-go/aws/session"
	"github.com/aws/aws-sdk-go/service/dynamodb"
	"github.com/aws/aws-sdk-go/service/kms"
	"github.com/aws/aws-xray-sdk-go/xray"
)

func init() {
	xray.Configure(xray.Config{
		LogLevel: "info",
	})
}

// DynamoDB is an xray instrumented DynamoDB client
func DynamoDB() *dynamodb.DynamoDB {
	c := dynamodb.New(session.Must(session.NewSession()))
	xray.AWS(c.Client)
	return c
}

// KMS is an xray instrumented KMS client
func KMS() *kms.KMS {
	c := kms.New(session.Must(session.NewSession()))
	xray.AWS(c.Client)
	return c
}
From aws.go
We can also use the X-Ray SDK to trace external HTTP calls, SQL calls, or create any custom segments and subsegments. Refer to the X-Ray SDK for Go developer guide for more details.
Results
After we deploy the application and make some calls to the API or workers, we can browse to the X-Ray web console to view our traces:
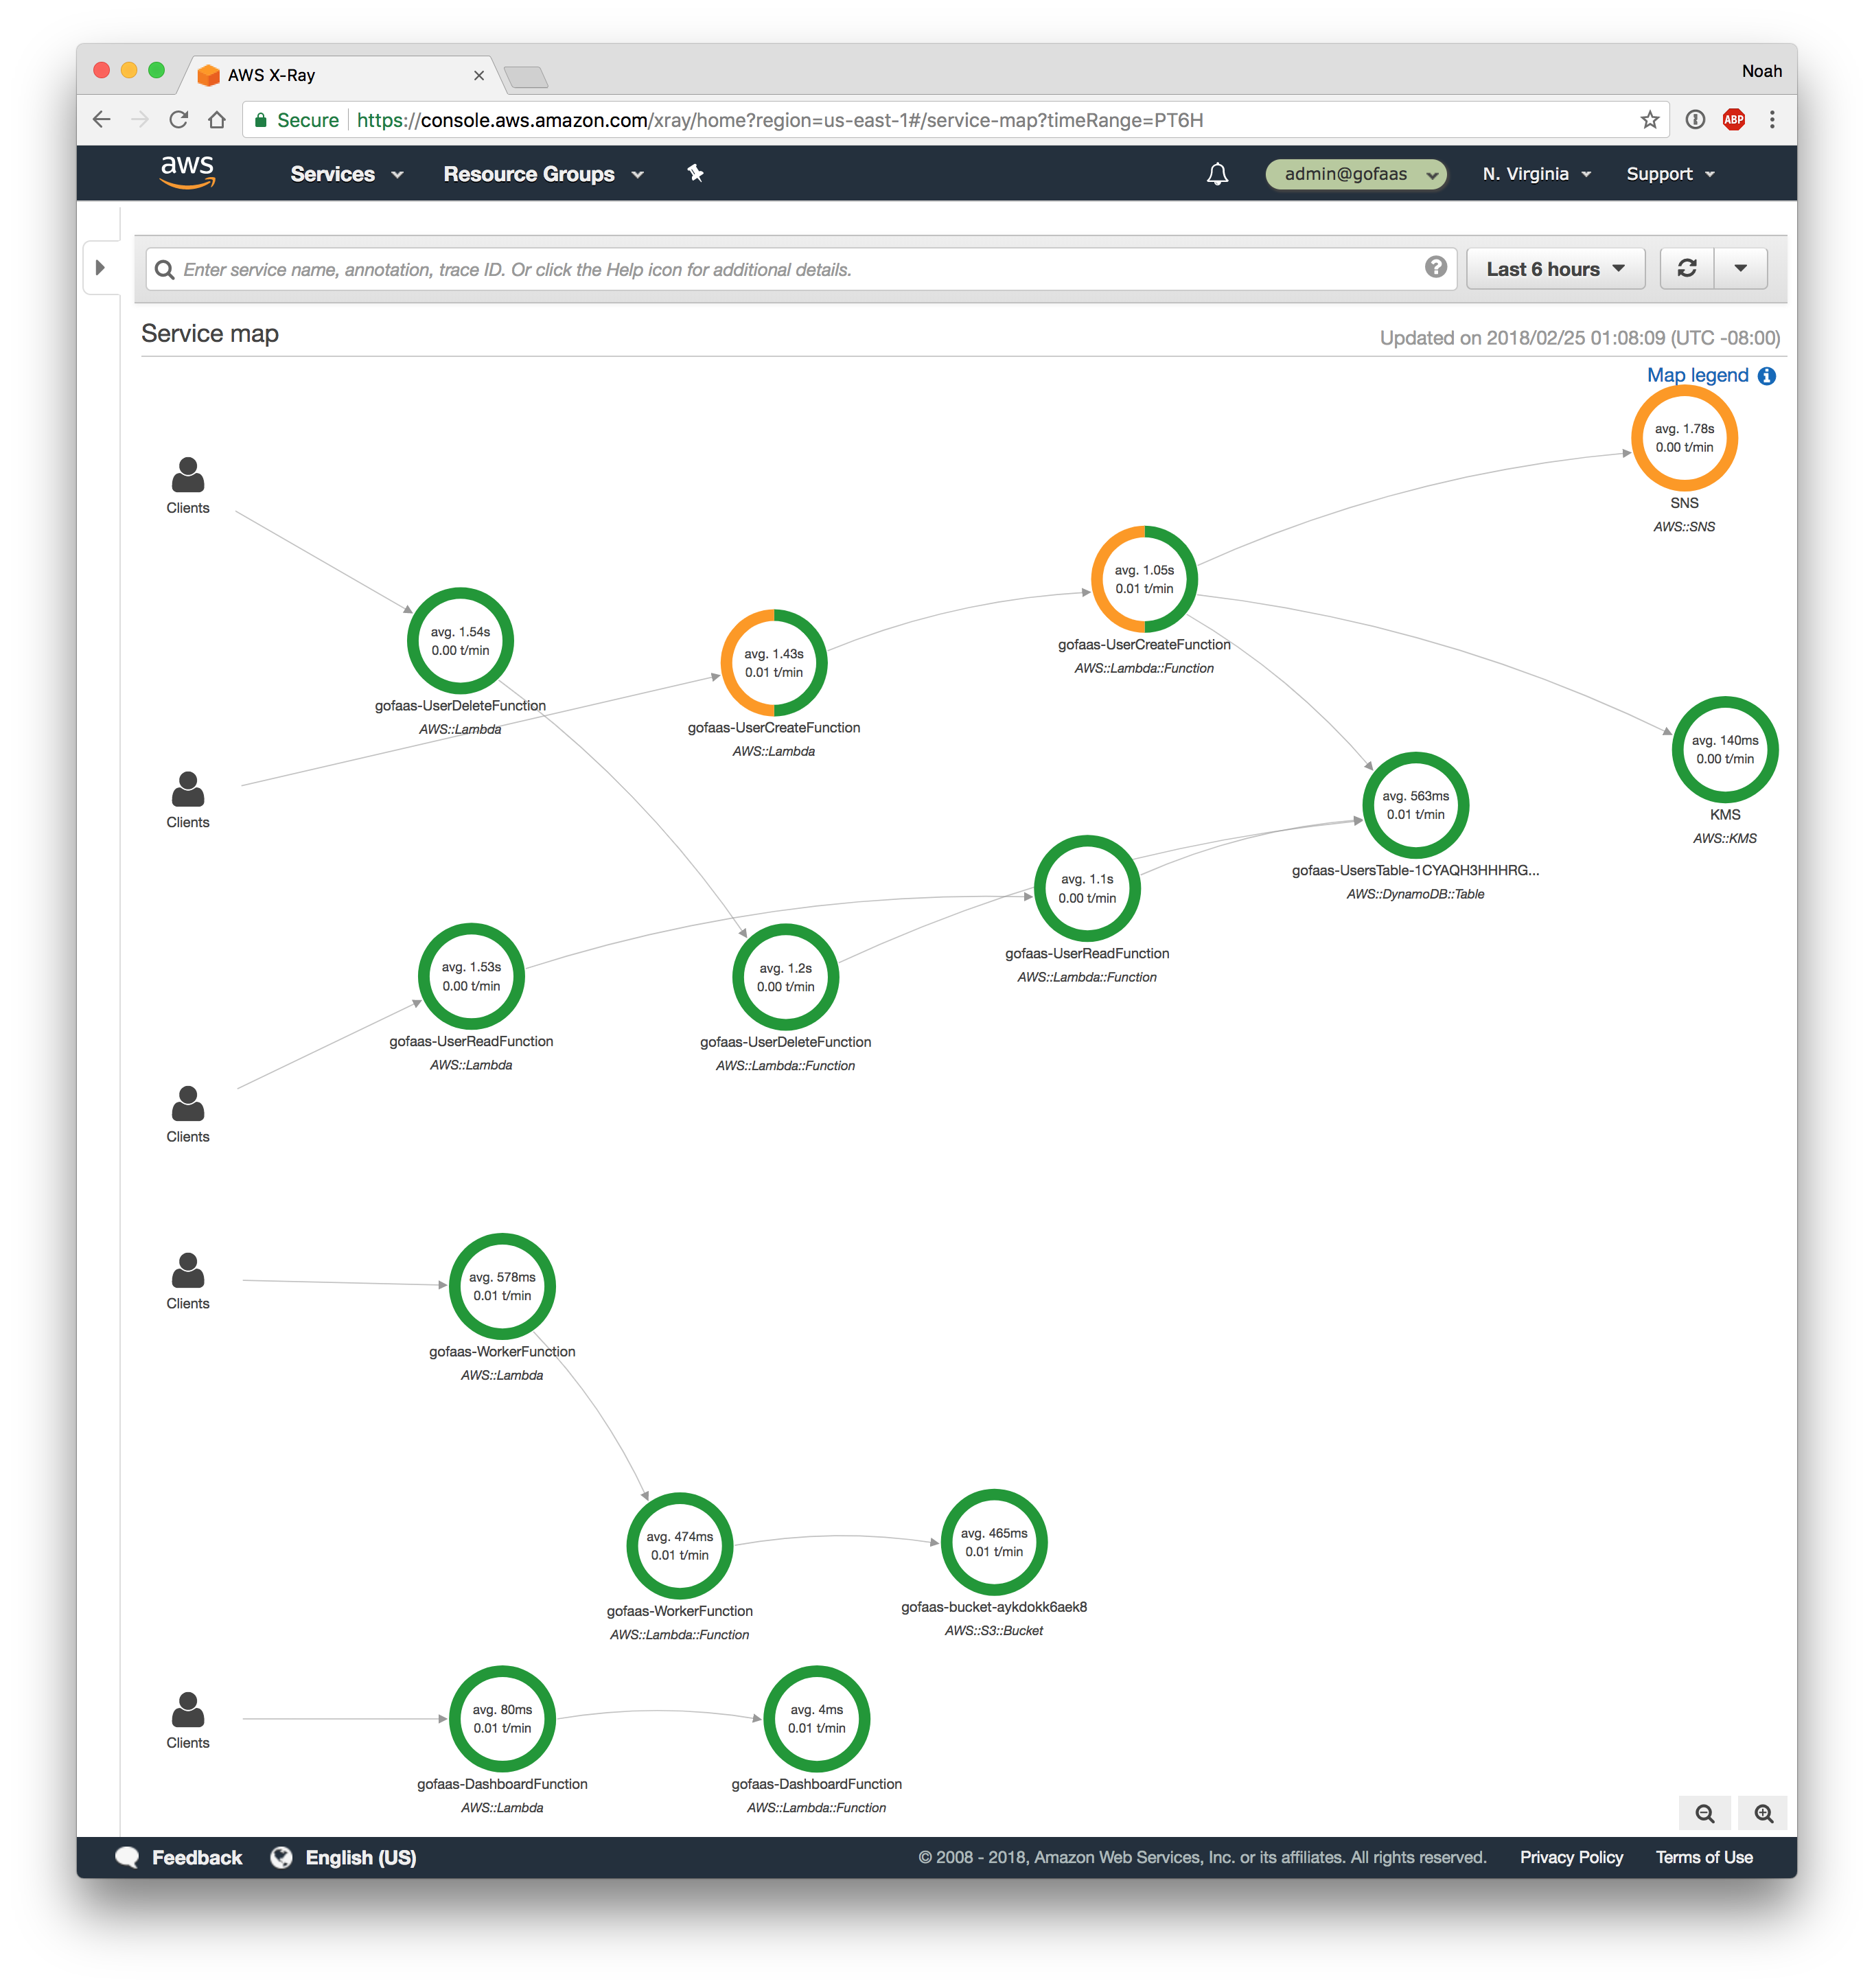
The service map offers a overview of our app. We can see all of the calls to our functions and the AWS APIs they consume. Note that we’re seeing an error with SNS calls. It turns out IAM permissions are incorrect… Tracing is already helping us pinpoint problems and we haven’t added a single log.
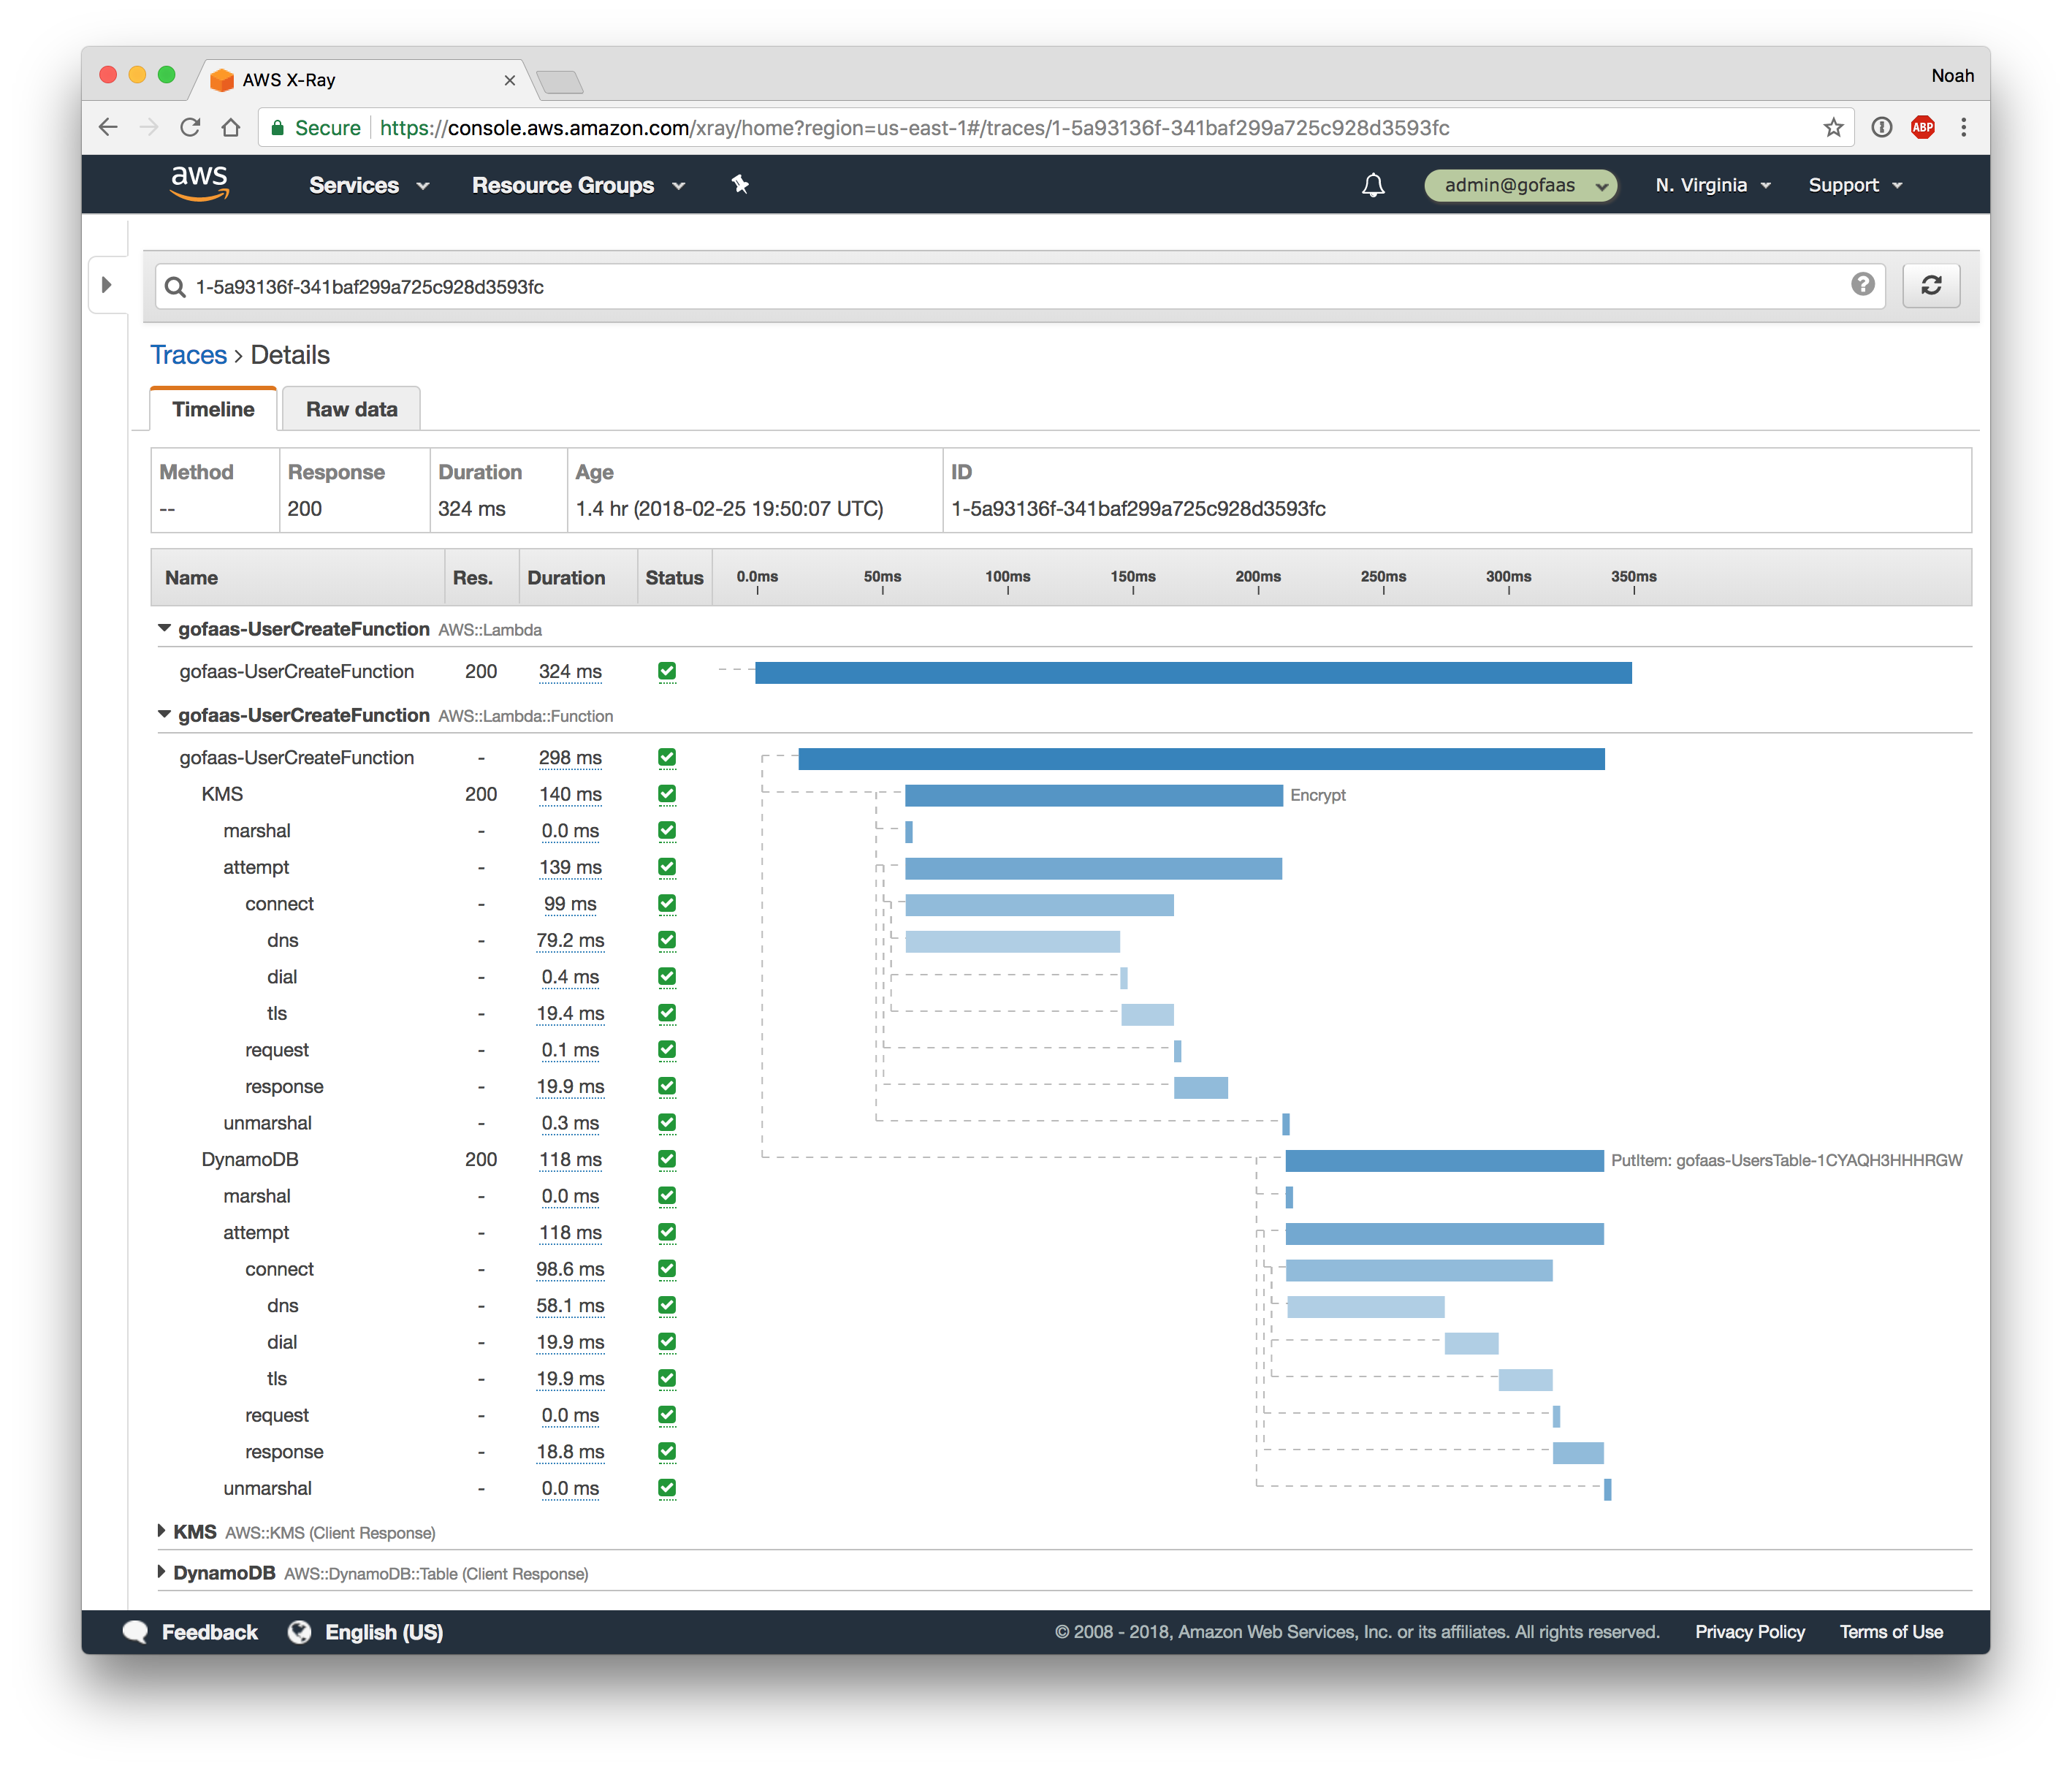
The trace details offers a deep dive into a function call. We can see our function took 324ms, and spent 140ms on the KMS call and 200ms on the DynamoDB call. This waterfall view can help us optimize our functions, which can ultimately save us money.
These are powerful views into our functions with little change to the code and config.
Summary
When building an app with Go, Lambda and X-Ray we can:
- See internal AWS service traces
- Add traces of function AWS API calls
- Add traces of function HTTP calls
- Visualize function flow and errors
We don’t have to:
- Change our Go code
- Monkey patch the language internals
- Manage trace collectors
- Run trace servers
Go, tracing and X-Ray and make our app easier to write and observe.